11.1. Parse timings from the log file#
11.1.1. Compare CONUS CycleCloud Runs#
Note
CycleCloud Configurations can impact the model run times.
It is up the the user, as to what model run configurations are used to run CMAQ on the CycleCloud. The following configurations may impact the run time of the model.
For different PE configurations, using 36 cpus out of 120 cpus on HBv120s
[ ] 6x6 #SBATCH –nodes=2, #SBATCH –ntasks-per-node=18
[ ] 6x6 #SBATCH –nodes=1, #SBATCH –ntasks-per-node=36
For different PE configurations, using 96 cpus out of 120 cpus on HBv120s
[ ] 8x12 #SBATCH –nodes=1, #SBATCH –ntasks-per-node=96
[ ] 16x12 #SBATCH –nodes=2, #SBATCH –ntasks-per-node=96
[ ] 16x18 #SBATCH –nodes=3, #SBATCH –ntasks-per-node=96
[ ] 16x24 #SBATCH –nodes=4, #SBATCH –ntasks-per-node=96
Ford ifferent filesystems /shared versus /beeond
[ ] input data copied to /shared
[ ] input data copied to /beeond
11.1.2. Edit the R script#
First check to see what log files are available:
ls -lrt /shared/build/openmpi_gcc/CMAQ_v54/CCTM/scripts/*.log
Modify the name of the log file to match what is avaible on your system.
cd /shared/pcluster-cmaq/qa_scripts
vi parse_timing.beeond.v54+.2018.12US1.r
Edit the following section of the script to specify the log file names available on your ParallelCluster
library(RColorBrewer)
library(stringr)
#sens.dir  <- '/shared/cyclecloud-cmaq/run_scripts/HB120v3_singleVM/'
sens.dir  <- '/shared/cyclecloud-cmaq/run_scripts/HB120v3_12US1_CMAQv54plus/'
base.dir  <- '/shared/cyclecloud-cmaq/run_scripts/HB120v3_12US1_CMAQv54plus/'
#files   <- dir(sens.dir, pattern ='run_cctm5.4plus_Bench_2018_12US1_cb6r5_ae6_20200131_MYR.192.8x12pe.2days.beeond.1x96.log')
files   <- dir(sens.dir, pattern ='run_cctm5.4plus_Bench_2018_12US1.96.12x8pe.2day.cyclecloud.shared.codefix.log')
#b.files <- dir(base.dir,pattern='run_cctmv5.3.3_Bench_2016_12US2.96.12x8pe.2day.cyclecloud.shared.codemod.nopin.redo.log')
b.files <- c('run_cctm5.4plus_Bench_2018_12US1_cb6r5_ae6_20200131_MYR.192.16x12pe.2days.20171222start.2x96.log', 'run_cctm5.4plus_Bench_2018_12US1_cb6r5_ae6_20200131_MYR.288.16x18pe.2days.20171222start.3x96.log', 'run_cctm5.4plus_Bench_2018_12US1_cb6r5_ae6_20200131_MYR.384.16x24pe.2days.20171222start.4x96.log' )
#Compilers <- c('intel','gcc','pgi')
Compilers <- c('gcc')
# name of the base case timing. I am using the current master branch from the CMAQ_Dev repository.
# The project directory name is used for the sensitivity case.
#base.name <- c('data_pin','lustre_pin','shared_pin')
base.name <- c('cmaq5.4plus_beeond_192', 'cmaq5.4plus_beeond_288', 'cmaq5.4plus_beeond_384' )
sens.name <- c('cmaq5.4plus_beeond_96')
11.1.3. R Timing Plot#
Use parse_timing.r script to examine timings of each process in CMAQ#
cd qa_scripts
Rscript parse_timing.beeond.v54+.2018.12US1.r
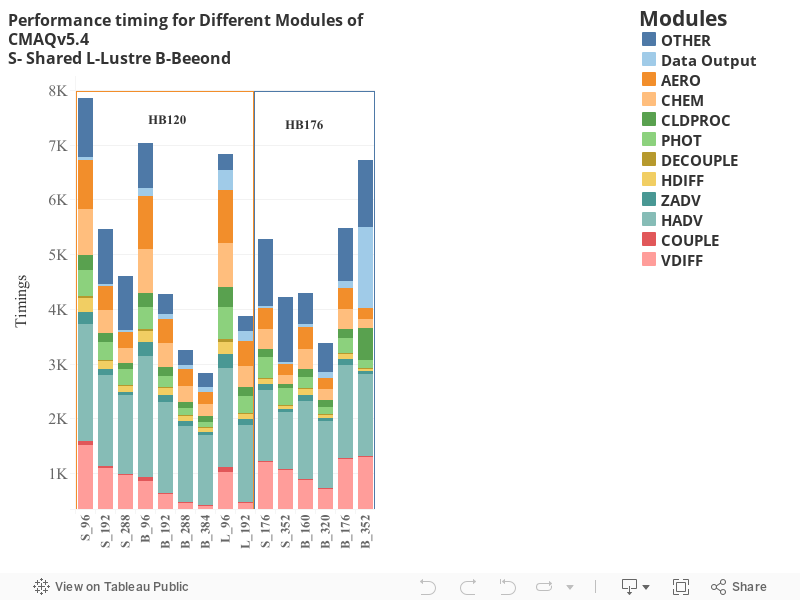
Timing Plot Comparing Total Run Time of CMAQv5.4 on 1, 2, 3, 4 Compute Nodes using HB120rs_v3 or HB176_v4 using Shared, Beeond and Lustre Filesystem; created by Manish Soni
Note: Click on Full Screen to see plot (icon in lower right corner, see icon circled in red in the image below the plot)